Working with TextGrids
- phonlab.tg_to_df(tg, tiersel=[], names=None)[source]
Read a Praat textgrid and return its tiers as a list of dataframes.
- Parameters:
tg (path-like) – Filepath of input textgrid.
tiersel (list of str or int) – Selection of tiers to include in the output list, identified by tier name (str) or 0-based integer index (int). If [] then all textgrid tiers are returned. Tiers can be selected in a different order than they appear in the textgrid.
names (None, str, or list of str (default None)) – Names of the label content columns in the output dataframes. If None, then the textgrid tier name is used as the column. If str then the same column name will be used for all dataframes. If list, then one name must be supplied for each tier selected by tiersel.
- Returns:
tiers – Textgrid tiers are returned as a list of dataframes for each tier, in the order selected by tiersel. The time columns of each dataframe are named t1 and t2 for label start and end times of interval tiers, or t1 for the timepoints of point tiers. The textgrid tier’s name is used as the name of the column containing the label content unless column names are provided by names. If tiers is an empty list [] then all textgrid tiers are returned in the list of dataframes.
- Return type:
list of dataframes
Example
In this example we have the name of an existing Praat Textgrid file, and use tg_to_df() to read the textgrid into a set of dataframes (one for each tier of the textgrid file.
textgrid_name = importlib.resources.files('phonlab') / 'data' / 'example_audio' / 'im_twelve.TextGrid'
phdf, wddf = phon.tg_to_df(textgrid_name, tiersel=['phone', 'word'])
phdf.head()
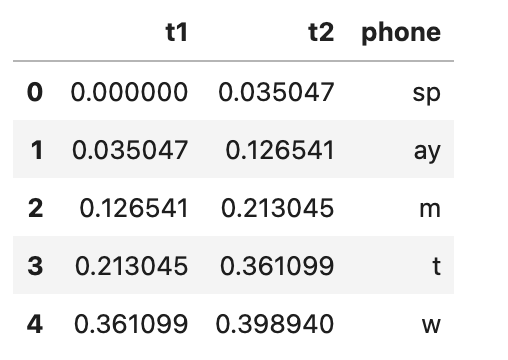
The first few rows of the phones dataframe (phdf) given by tg_to_df()
- phonlab.df_to_tg(dfs, tiercols, ts=['t1', 't2'], start=0.0, end=None, tgtype='short', codec='utf-8', fmt=None, fill_gaps='', allow_overlaps=False, outfile=None)[source]
Convert one or more dataframes to a Praat textgrid.
Each input dataframe represents a textgrid tier. Each dataframe row represents a label. There must be a column in each dataframe to provide 1) the label text content; 2) the label start time for an IntervalTier or point time for a PointTier (t1); and 3) the label end time for an IntervalTier (t2).
If the t1 and t2 columns are numeric types, they are converted to str type without any special formatting, unless the fmt parameter is used.
The dataframes are converted to labels as-is. No sorting is performed before creating the textgrid.
- Parameters:
dfs (dataframe or list of dataframes) – The input dataframes of labels. Each df represents a separate textgrid tier.
tiercols (str or dict or list of str/dict) – The column name in each dataframe in dfs that contains the label content. If the name is provided as a str, that name will also be the tier’s name in the output textgrid. If a different name for the tier is desired, use a single-element dict to map the column name to the textgrid tier name, e.g. {‘text’: ‘word’} maps the ‘text’ column of a dataframe to a textgrid tier named ‘word’. For multiple dataframes use a list of single-element dicts, e.g. [{‘text’: ‘word’}, {‘text’: ‘phone’}, ‘context’] to map the ‘text’ column of the first dataframe to a tier named ‘word’ and the ‘text’ column of the second dataframe to a tier named ‘phone’. The third dataframe in this example has a column named ‘context’ that will also be the name of the textgrid tier.
ts (list of str or list of list of str (default=['t1', 't2'])) – The column names in each dataframe in dfs that hold the start and end times of the labels. For Point tiers Use None as the second value. If this value is a simple list, then all dataframes must be of the same Interval/Point type with the same names for the time columns. For a mix of Interval and Point tier types, or if time column names vary among the dataframes, use a list of two-element lists to specify the column names for each dataframe.
start (num or None (default=0.0)) – The start time of the textgrid. If None, the start time will be the minimum label time value among all the dataframes.
end (num or None (default=None)) – The end time of the textgrid. If None, the end time will be the maximum label time value among all the dataframes.
tgtype (str, default='short') – The Praat textgrid output type. Must be one of ‘short’ or ‘long’.
codec (str (default 'utf-8')) – The codec used to write the textgrid (e.g. ‘utf-8’, ‘ascii’).
fmt (str or None (default None)) – The format string to apply to all time columns, as used by the format <https://docs.python.org/3/library/stdtypes.html#str.format> built-in method, for example, ‘0.4f’ for four-digit floating point.
fill_gaps (str or None (default '' empty string)) – When fill_gaps is not None, new labels will be inserted into IntervalTier outputs where consecutive dataframe rows are not contiguous in time (rows in which the end time of one row is less than the start time of the next row). The string value of fill_gaps is used as the text content of the inserted labels.
allow_overlaps (bool (default False)) – When allow_overlaps is False, raise an error if any interval labels in a tier overlap in time with another label in the same tier. If True, then the textgrid will be created with the overlaps and a warning message will be sent to STDERR. NOTE: textgrids with overlapping labels cannot be opened in Praat.
outfile (file path, optional) – If provided, write the textgrid to outfile and return None instead of the textgrid content.
- Returns:
tg – The textgrid output as a str. If outfile is specified, then None is returned instead.
- Return type:
str or None
Example
wddf = pd.DataFrame({                   # create example dataframes
    'word': ['', 'a', 'word'],
    't1': [0.0, 0.1, 0.23647890019],
    't2': [0.1, 0.2, 0.3],
})
ptdf = pd.DataFrame({      # a point tier
    'pt': ['pt1', 'pt2'],
    't1': [0.05, 0.15],
})
ctxdf = pd.DataFrame({
    'ctx': ['nonspeech', 'speech'],
    't1': [0.0, 0.1],
    't2': [0.1, 0.3]
})

# Single tier textgrid.
phon.df_to_tg(wddf, tiercols='word', outfile='word.TextGrid')

# Single tier textgrid where the column name doesn't match the tier name.
phon.df_to_tg(
    ctxdf,
    tiercols={'ctx': 'context'},
    outfile='ctx.TextGrid'
)

# Two-tier textgrid. One tier name matches the column name and one does not.
phon.df_to_tg(
    [wddf, ctxdf],
    tiercols=['word', {'ctx': 'context'}],
    outfile='wordctx.TextGrid'
)

# Three-tier textgrid of two interval tiers and one point tier. The
# label content is in the 'word', 'pt', and 'ctx' columns, and the
# textgrid tiernames will be 'word', 'pointevent', and 'context'.
phon.df_to_tg(
    [wddf, ptdf, ctxdf],
    tiercols=['word', {'pt': 'pointevent'}, {'ctx': 'context'}],
    ts=[['t1', 't2'], ['t1', None], ['t1', 't2']],
    outfile='wordptctx.TextGrid'
)

# Specify numeric output to four decimal places.
phon.df_to_tg(wddf, 'word', fmt='.4f', outfile='wordt1str.TextGrid')
- phonlab.add_context(df, col, nprev, nnext, prefixes=['prev_', 'next_'], fillna='', ctxcol=None, sep=' ')[source]
Add shifted versions of a dataframe column to provide context within rows. For example, if you have a dataframe of phone labels you can use this function to add the preceding/following phone context to each row.
- Parameters:
df (dataframe) – The input dataframe.
col (str) – The name of the column for which context is desired.
nprev (int) – The number of preceding values of col to add as context.
nnext (int) – The number of following values of col to add as context.
prefixes (list of str (default [‘prev_’, ‘next_’])) – Prefixes to use as column names. The first value of the list is the prefix to use for preceding context, and the second value is the prefix for following context, e.g. ‘prev_word2’, ‘prev_word1’, ‘next_word1’, ‘next_word2’.
fillna (str (default '')) – Value to use to fill empty values created by shift at beginning and end of col.
ctxcol (str or None (default None)) – If not None, add a string column that join`s `col and its preceding/following context in order, separated by sep.
sep (str (default ' ')) – String separator used to join context in ctxcol.
- Returns:
df – The original input dataframe with new context columns added. Note that the new columns are inserted in order around col.
- Return type:
dataframe
Example
In this example we have the name of an existing textgrid, read it into a Pandas dataframe with phon.tg_to_df() and then with phon.add_context() add two context columns to the dataframe, one for the previous phone, and one for the following phone.
textgrid_name = importlib.resources.files('phonlab') / 'data' / 'example_audio' / 'im_twelve.TextGrid'

phdf, wddf = phon.tg_to_df(textgrid_name, tiersel=['phone', 'word'])
phdf = phon.add_context(phdf,'phone',nprev=1,nnext=1)
phdf.head()
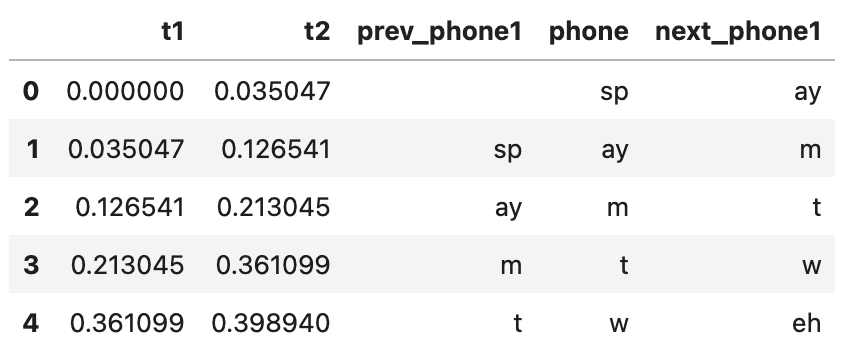
The first few rows of the phones dataframe (phdf) given by add_context()
- phonlab.merge_tiers(inner_df, outer_df, suffixes, inner_ts=['t1', 't2'], outer_ts=['t1', 't2'], drop_repeated_cols=None)[source]
Merge hierarchical dataframe tiers based on their times.
- Parameters:
inner_df (dataframe) – The dataframe whose intervals are properly contained inside outer_df.
outer_df (dataframe) – The dataframe whose intervals contain one or more intervals from inner_df.
suffixes (list of str) – List of suffixes to add to time columns in the output dataframe. The first suffix is added to the names in inner_ts, and the second suffix is added to the names in outer_ts. If the names in inner_ts and outer_ts do not overlap, then empty string suffixes may be appropriate.
inner_ts (list of str) – Names of the columns that define time intervals in inner_df. The first value is the start time of the interval, and the second value is the end time. For point tiers, only one column should be named.
outer_ts (list of str) – Names of the columns that define time intervals in outer_df. The first value is the start time of the interval, and the second value is the end time. For point tiers, only one column should be named.
drop_repeated_cols (str ('inner', 'inner_df', 'outer', 'outer_df', None)) – Drop each column from the specified dataframe if there is a column with an identical label in the other input dataframe. The inner_ts and outer_ts columns are excluded from being dropped. If None, no columns are dropped.
- Returns:
mergedf – Merged dataframe of time-matched rows from inner_df and outer_df.
- Return type:
dataframe
Example
In this example we have the name of an existing Praat TextGrid file, we read it into Pandas DataFrames with phon.tg_to_df(), and then merge two of the dataframes into a single larger dataframe that has all of the information that was in them using phon.merge_tiers(). The inner dataframe is the one with intervals/events that are inside the intervals/events in the outer dataframe. In this case the intervals in the ‘phone’ tier are contained in the intervals in the ‘word’ tier.
textgrid_name = importlib.resources.files('phonlab') / 'data' / 'example_audio' / 'im_twelve.TextGrid'
phdf, wddf = phon.tg_to_df(textgrid_name, tiersel=['phone', 'word'])
tgdf = phon.merge_tiers(inner_df=phdf, outer_df=wddf, suffixes=['', '_wd'])
tgdf.head()
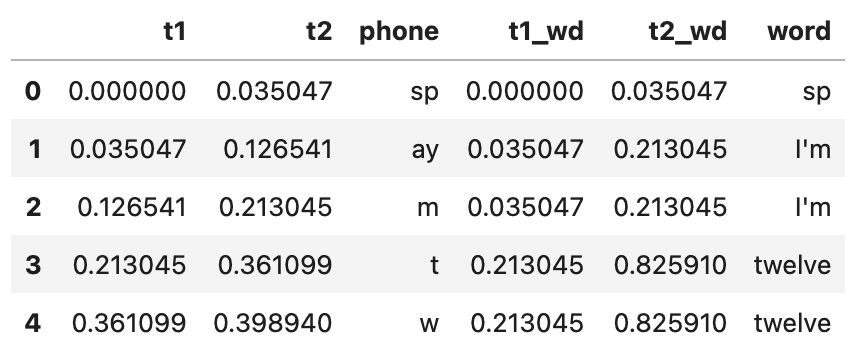
The first few rows of the combined dataframe given by merge_tiers()
- phonlab.explode_intervals(divs, ts=['t1', 't2'], df=None, prefix='obs_')[source]
Divide a series of time intervals into subintervals and explode into long format, with one row per subinterval timepoint. An interval [2.0, 3.0] divided into two subintervals, for example, produces three output rows for the times corresponding to 0%, 50%, and 100% of the interval: 2.0, 2.5, 3.0.
The subinterval divisions can be specified as an integer number of subdivisions, or as a list of interval proportions in the range [0.0, 1.0]. For int the number of timepoints produced is the number of subintervals + 1, and for a list of proportions one timepoint is produced for each element of the list.
- Parameters:
divs (int, list of float in range [0.0, 1.0]) – The subintervals to include. If int, the number of equal-duration subintervals each interval will be divided into. If a list, the values should be in the range [0.0, 1.0] and express proportions of the duration of each interval for which subinterval timepoints will be created. For example, [0.25, 0.50, 0.75] yield timepoints at 25%, 50%, and 75% of each input interval.
ts (list of str or list of numeric scalar/list/Series/arrays) – If list of str, these are the names of time columns in the df dataframe. The first name defines the start time of the interval to be subdivided, and the second name defines the end time. For numeric values, provided as a scalar, list, pd.Series, or np.array, the first scalar/list/Series/array provides the start times, and the second provides the end times.
df (dataframe) – A dataframe containing start and end times of the intervals to be subdivided, or None if ts provides the times directly as Series/arrays rather than names. An arbitrary number of additional columns may be included in the dataframe.
prefix (str (default 'obs_t')) – The prefix to use when naming the output columns of timepoints (f’{prefix}n’) and timepoint identifiers (f’{prefix}id’).
- Returns:
divdf – A dataframe of subinterval timepoints with an index that matches the index of ts. The timepoints are in a column labelled obs_t by default. A second column that identifies the timepoint’s location within the series of timepoints is named obs_id by default. If divs is an int these identifiers are integers in the range [0, divs]. If divs is a list of proportions, the proportions are used as the identifiers.
- Return type:
dataframe
Note
divdf is merged with the input dataframe df if it is provided. If this behavior is not desired, then df should be None. For example, use ts=[df[‘t1’], df[‘t2’]], df=None instead of ts=[‘t1’, ‘t2’], df=df.
Example
In this example we have a dataframe produced by phon.tg_to_df(), and phon.merge_tiers() which has columns for each phone and it’s starting and ending times (t1,t2). We use the Pandas function query to get a subset dataframe that just has vowels in it, and then use phon.explode_intervals() to add new rows specifying the time points at 20%, 50% and 80% of the way through each vowel.
vowels = ['ay', 'eh', 'iy', 'aa', 'aw']
vdf = tgdf.query(f'phone in {vowels}').copy()  # make a dataframe that just has vowels
vdf = phon.explode_intervals([0.2,0.5, 0.8], ts=['t1', 't2'], df=vdf) # get times for observations
vdf.head()
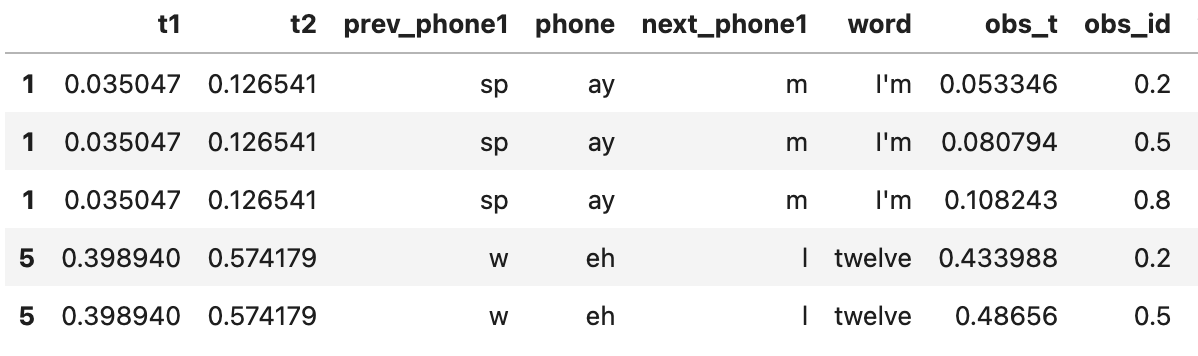
The first few rows of a ‘vowels’ dataframe with observation points added by phon.explode_intervals()
- phonlab.interpolate_measures(meas_df, meas_ts, interp_df=None, interp_ts=None, tol=None, overwrite=False)[source]
Interpolate measurements from an analysis dataframe consisting of a time-based column and one or more columns containing measurement values. Linear interpolation of measurement values is performed for times specified by the time column of another dataframe or from an array or list of times.
This function provides an interface to numpy.interp() in order to add acoustic or articulatory measurements from a dataframe that has measurements at monotonically increasing timepoints through the whole file (like F0 measurements at 5 ms intervals for example) to a dataframe that has target locations at which we would like to extract measurements (like vowel midpoints, for example).
- Parameters:
meas_df (dataframe) – Measurement dataframe containing a time column and one or more columns of measurements. All the measurement columns must be a numeric type and able to be interpolated. Non-numeric columns from an input dataframe must be removed before calling this function.
meas_ts (str) – Name of the time column in meas_df. Values in this column must be in increasing order.
interp_df (dataframe) – Dataframe containing a time column with times for which interpolated values are desired. If None, then interp_ts must provide the time values as an array or list.
interp_ts (str, array-like or list) – If a string, interp_ts is the name of a time column in interp_df. If an array or list of time values, then interp_df must be None.
tol (float (default None)) – Maximum allowed distance from each interpolation timepoint to its nearest measurement timepoint. If None, the tolerance will be automatically calculated as half the mean step between measurement timepoints.
overwrite (bool (default False)) – If True, overwrite existing measurements in interp_df from columns of the same names in meas_df. If False, an error is raised when column names overlap. Measurement columns from meas_df that do not overlap interp_df are always added as new columns.
- Returns:
df – The output dataframe of measurements. If interp_df is a dataframe, then interpolated values from the measurement columns of meas_df are concatenated as new columns to interp_df and returned. Otherwise, a dataframe of interpolation times and corresponding measurement values is returned. If interp_ts has an index, that index is used as the returned dataframe’s index, and a default index is assigned otherwise.
- Return type:
dataframe
Example
TextGrid information is in a dataframe vdf, which has a column obs_t of times at which we would like to have formant measurements from the data in file ‘im_twelve.csv’ (produced by phon.track_formants()). The function phon.interpolate_measures() extracts data from the formants dataframe and adds measurements at the desired observation times in the textgrid dataframe.
fmtsdf = pd.read_csv('im_twelve.csv')  # read in the csv of formants measurements

vdf = phon.interpolate_measures(
    meas_df=fmtsdf[['sec','F1', 'F2', 'F3', 'F4']],  # meas_ts and cols to interpolate only
    meas_ts='sec',        # time index in the measurements dataframe
    interp_df=vdf,       # textgrid dataframe
    interp_ts='obs_t',  # target observation times in the textgrid
    overwrite=True
)
vdf.head()
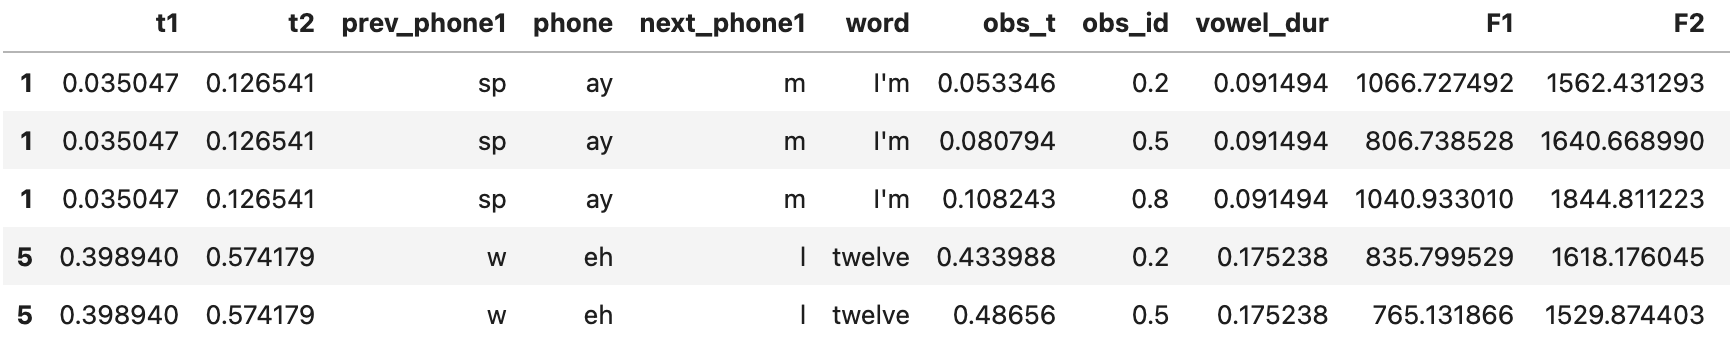
The first few rows of a ‘vowels’ dataframe with with formant measurements added by phon.interpolate_measures()
- phonlab.adjust_boundaries(inner_ts, outer_ts, tolerance)[source]
Compare two Series and return the closest match of the second found in the first.
Two annotation tiers may be expected to have a strictly hierarchical relationship where the boundaries should exactly align, e.g. the left boundary of a word tier aligns with the left boundary of a phone (and right boundaries should also align). If the annotations were not created carefully and do not match exactly, this function can be used to adjust values of one (the outer_ts) to match a value found in the other (the inner_ts). For example, the outer_ts value could be the left boundaries of a series of words, and the inner_ts value could be the left boundaries of a series of phones.
Normally the outer_ts series has a one-to-many relationship with the inner_ts series, and the inner_ts series has a many-to-one relationship with the outer_ts. In the preceding discussion, words contain multiple phones.
- Parameters:
outer_ts (Series of num) – A series of time values that correspond to outer_ts boundaries.
inner_ts (Series of num) – A series of time values that correspond to inner_ts boundaries.
tolerance (num) – Maximum distance from outer_ts to inner_ts value for inexact matches.
- Returns:
mod_outer_ts (array) – A modified numpy array of time values of outer_ts in which each value is an exact
match of a value in inner_ts.
- Raises:
ValueError – A ValueError is raised if one or more boundaries are not within tolerance. A list of the values from outer_ts that are out of tolerance is included as the second value of the Exception object’s args attribute. An error message is the first value of args.:
Examples
Read phone and word tiers from a textgrid.
[phdf, wddf] = phon.tg_to_df(tgpath, tiersel=['phone', 'word'])

# Adjust word 't1' values up to 5 ms.
try:
   wddf['t1'] = phon.adjust_boundaries(wddf['t1'], phdf['t1'], tolerance=0.005)
except ValueError as e:
   badt = ', '.join([f'{t:0.4f}' for t in e.args[1]])
   msg = f"Word-phone boundary mismatch greater than {tolerance} in {tgpath}. "              f"Bad word boundary found at time(s) {badt}."
   raise ValueError(msg) from None